Vmware Management Pack for SCOM

Many companies have a need for monitoring their VMWare infrastructure and almost always the only alternative that shows up is the extremly extensive and costly Veeam Management Pack for System Center.

But is this really the only alternative and do you need an MP this extensive? Some organisations have smaller environments and the primary tool to monitor and troubleshoot VMWare is vCenter.

That’s why I created my own VMWare Management. This MP has a very light load, captures the “defined alarms” out of your vCenter and translates them into SCOM alerts.

For those interested, feel free to leave me a note. I’ll be glad to give some more insights.

Some screenshots:

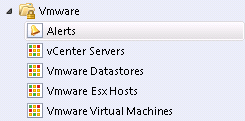
Folders created after import

VmwareViews

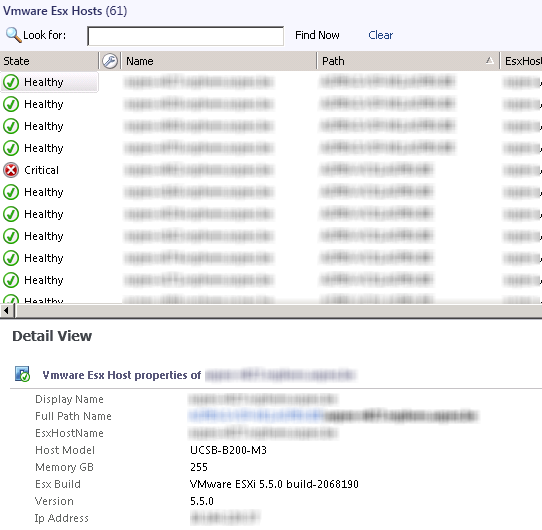
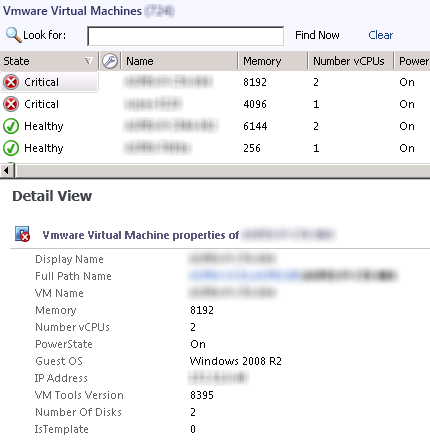
Esx Host, VM and Datastore Discoveries
All these are discovered with a large number of properties.
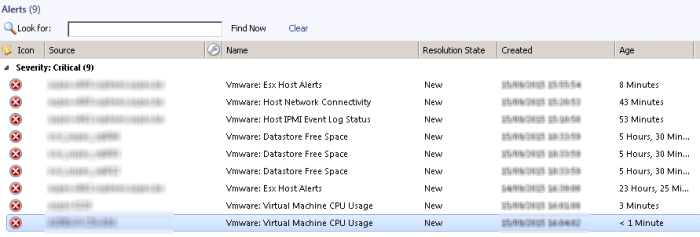
EsxHosts

VirtualMachines

Alert View
As already mentioned every configured alert in your vCenter can be captured into your SCOM environment.


VmwareAlertsView

For those interested, I’ve made the Management Pack available through the following link https://1drv.ms/f/s!AvZD1kbn8-n_am2uLPmtw3JWrZk
Feel free to leave a comment.


Enable webseal debug logging

Somewhere along Troubleshooting Webseal issues, you’re probably going to enable detailed logging. This will show you how to do this.

http://publib.boulder.ibm.com/tividd/td/ITAME/GC23-4682-00/en_US/HTML/ws-agmst40.htm

1. Start the Tivoli Access Manager Command Prompt (start > Program Files > Tivoli Access Manager => Administration command prompt) Type login and enter the Username & Password.

2. Now you need to have the correct “webseald-<instance>”. This can easily be obtained by using server list

3. Use server task webseald-YourInstanceRecorededInStep2 trace show to show which tracing in currently enabled

4. Use server task webseald-YourInstanceRecorededInStep2 trace list to list the components on which you can set tracing

5. Use server task webseald-YourInstanceRecorededInStep2 trace set <component> <level> [<log-agent>].

Level 1 specifies the most detailed output and level 9 specifies the least detailed output.

ie: server task webseald-YourInstanceRecorededInStep2 trace set pdweb.debug 2 file path=c:\temp\debug.log

6. Reproduce your Problem and Stop tracing by using server task webseald-YourInstanceRecorededInStep2 trace set pdweb.debug 0

List Processes that consume most CPU on a remote server

If you ever had an issue where your server is using 100% of CPU and you’re unable to log in to it, this little powershell cmdlet might come in very handy. It lists the 5 most consuming resources on the remote server.

Gwmi -computerName YOURSERVERNAME Win32_PerfFormattedData_PerfProc_Process | select IDProcess,Name,PercentProcessorTime | where { $_.Name -ne “_Total” -and $_.Name -ne “Idle”} | sort PercentProcessorTime -Descending | select -First 5

To get the user that is running this process use:

(gwmi win32_process  -ComputerName YOURSERVERNAME  | where {$_.ProcessId -eq ‘YOURPROCESSID’}).GetOwner().User

And if you also want to Terminate a process enter the following cmdlet and adjust the ProcessId.

(Get-WmiObject -ComputerName YOURSERVERNAME -Class Win32_Process | where {$_.ProcessId -eq ‘XXXX‘}).terminate()

Users can’t logon to Citrix Server after Reboot

After rebooting a number of citrix servers, users weren’t able to logon to some of the servers in the farm. When checking the Citrix Services we noticed that the “Citrix Independent Management Architecture service” was in the “starting” or “stopped” status and the “Citrix MFCOM Service” was also “Starting”.

CtxServiceFaulted

When starting the “Citrix Independent Management Architecture service” we got the following error.

ErrorOnStart

This Issue is documented here http://support.citrix.com/article/CTX032712

To recreate the local host cache, stop the IMA Service, then run dsmaint recreatelhc

recreatelhc

And start the “Citrix Independent Management Architecture service”

CtxServicesOK

Now all services are back to normal, including the “Citrix MFCOM Service” and users can log back on.

Using Process Monitor to measure logon times

Did you ever get complaints about slow logon times for users running on a Terminal Server? Probably the answer is yes, but what is slow? And can I measure this with hard numbers? Yes you can do this… By using Process Monitor! And I will show you how.

Step 1

Logon to the server with the local Administrator account and start Process Monitor.

Stop the capture and clear everything, this prevents the ProcMon from using unnecessary resources for now.

ProcMon_captureEvents

Step 2

Edit the Filter as follows. Add the processes winlogon.exe, userinit.exe and explorer.exe

Also filter to only show process Start and Exit.

ProcMon_Filter

– Winlogon.exe: You can see the first process to kick of is the Winlogon.exe. It is starting on logon and ends when a user clicks the start => logof button.

– Userinit.exe: Next one to launch is the userinit.exe process which includes various user initializations. This process will also have a Process Exit after a while, which means the users session is fully initialized.

– Explorer.exe: When explorer.exe starts the user will first see the dialogbox saying “Loading your personal settings, ….” and he will then get his start menu, meaning he can start working.

Also in the ProcMon uncheck to show Registry, system & Network Activity

ProcMon_Filter2

Step 3

Start the capture by clicking the “Capture Events” and immediately start another rdp logon session under the user’s account. You will see ProcMon showing the processes start & exit.

ProcMon_StartProc1

So now we need the Start Time for Winlogon.exe and the Start Time for Explorer.exe. All the time between these two is the time a user is waiting for something to happen.

In this case the Logon time was exactly 41seconds

Step 4

If you want to go further in to details on what was exactly running you can start the ProcMon Process Tree. This gives you very fine-grained details about all processes running during the logon.

ProcMon_ProcTreeResult


Samuel.